
CHES 2016 tutorial part 2: Micro-Architectural Side-Channel Attacks posted August 2016
Yuval Yarom starts the afternoon of the workshop with a few slides on timing attacks, showing us that they are becoming more and more common in hardware. Eventhough OpenSSL classifies timing attacks as low severities, because they are hard to perform, Yarom thinks they are easy to perform.
He has a tool called "Mastik" for Micro-Architectural Side-channel toolkit. It currently implements prime+probe on L1-D, L1-l, L3 and flush+reload. There is no documentation, and he's hopping we'll give him feedback in the future. The slides and the Mastik tools are here.
Yarom starts by classifying these kind of attacks: by core shared, packet shared, system shared...
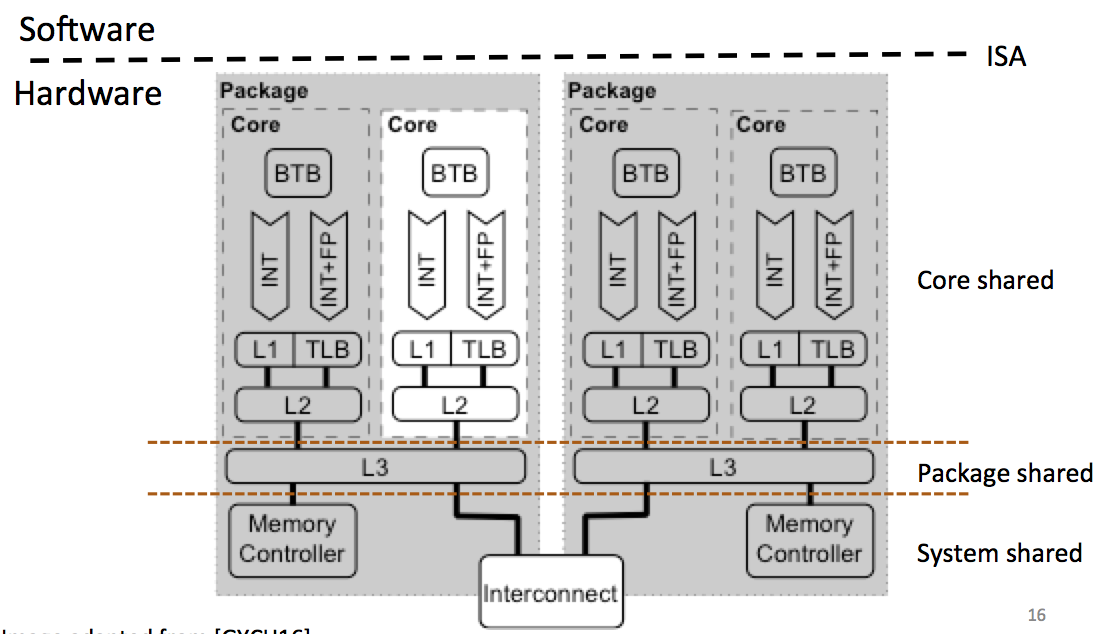
With time, the number of processors are increasing, so our odds of running on the same core as the victim are decreasing.
He then looks at other ways to classify attacks: persistent-state attacks and transient-state attacks. The second one needs the attacker and the victim running at the same time it seems.
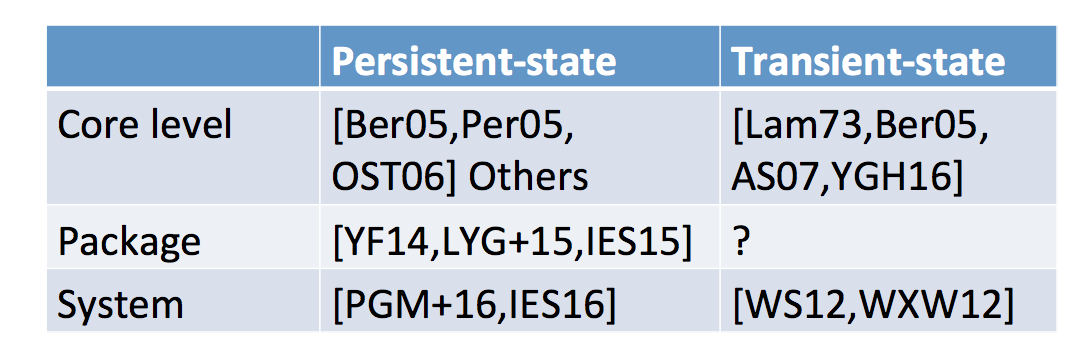
Other classifications he talks about are:
- time-driven, trace-driven, access-driven. This classification makes more sense if you look at how you do the attack, which is not great according to Yarom.
- Internal vs external contention: if the contention is internal then you can do a remote attack (the AES timing attack of djb on OpenSSL)
- degree of concurrency (multicore, hyperthreading, time slicing)
Yarom then switch the topic to memory. Memory is slower than the processor and that's why they build the cache. It's a more expensive technology and much closer to the CPU so it is faster than memory access. The CPU uses the cache to store the recent lines of memory read there. If you have many cores, the other cores can use what has been cached by one of them, and so you save time.
Inconsistency between memory and cache happens. So sometimes you want to flush the data in the cache to make sure that the next load is served directly from the memory (where it is insured to be correct). That's the basis of the flush+reload attack!
A bit of recap on memory: processes execute themselves within a virtual address space (addresses are "fake"). Then these fake addresses are mapped to physical memory addresses. This way processes don't collude in memory. and don't need to use crazy addresses (they can start at zero).
We use "sharing" of cache to save physical memory. Think shared libraries. If two programs use the same shared library, we can map this shared library to the same location. The operating system can be more agressive and do page deduplication: it detects duplicated memory patterns and de-duplicate them, removing one of them, then mapping the two program to the same region in memory. If one of the processes then wants to modify some of that shared memory, the system will copy it somewhere else so that he can do that. It was very popular with hypervisors back then but since cache attacks are a thing we don't do that anymore.
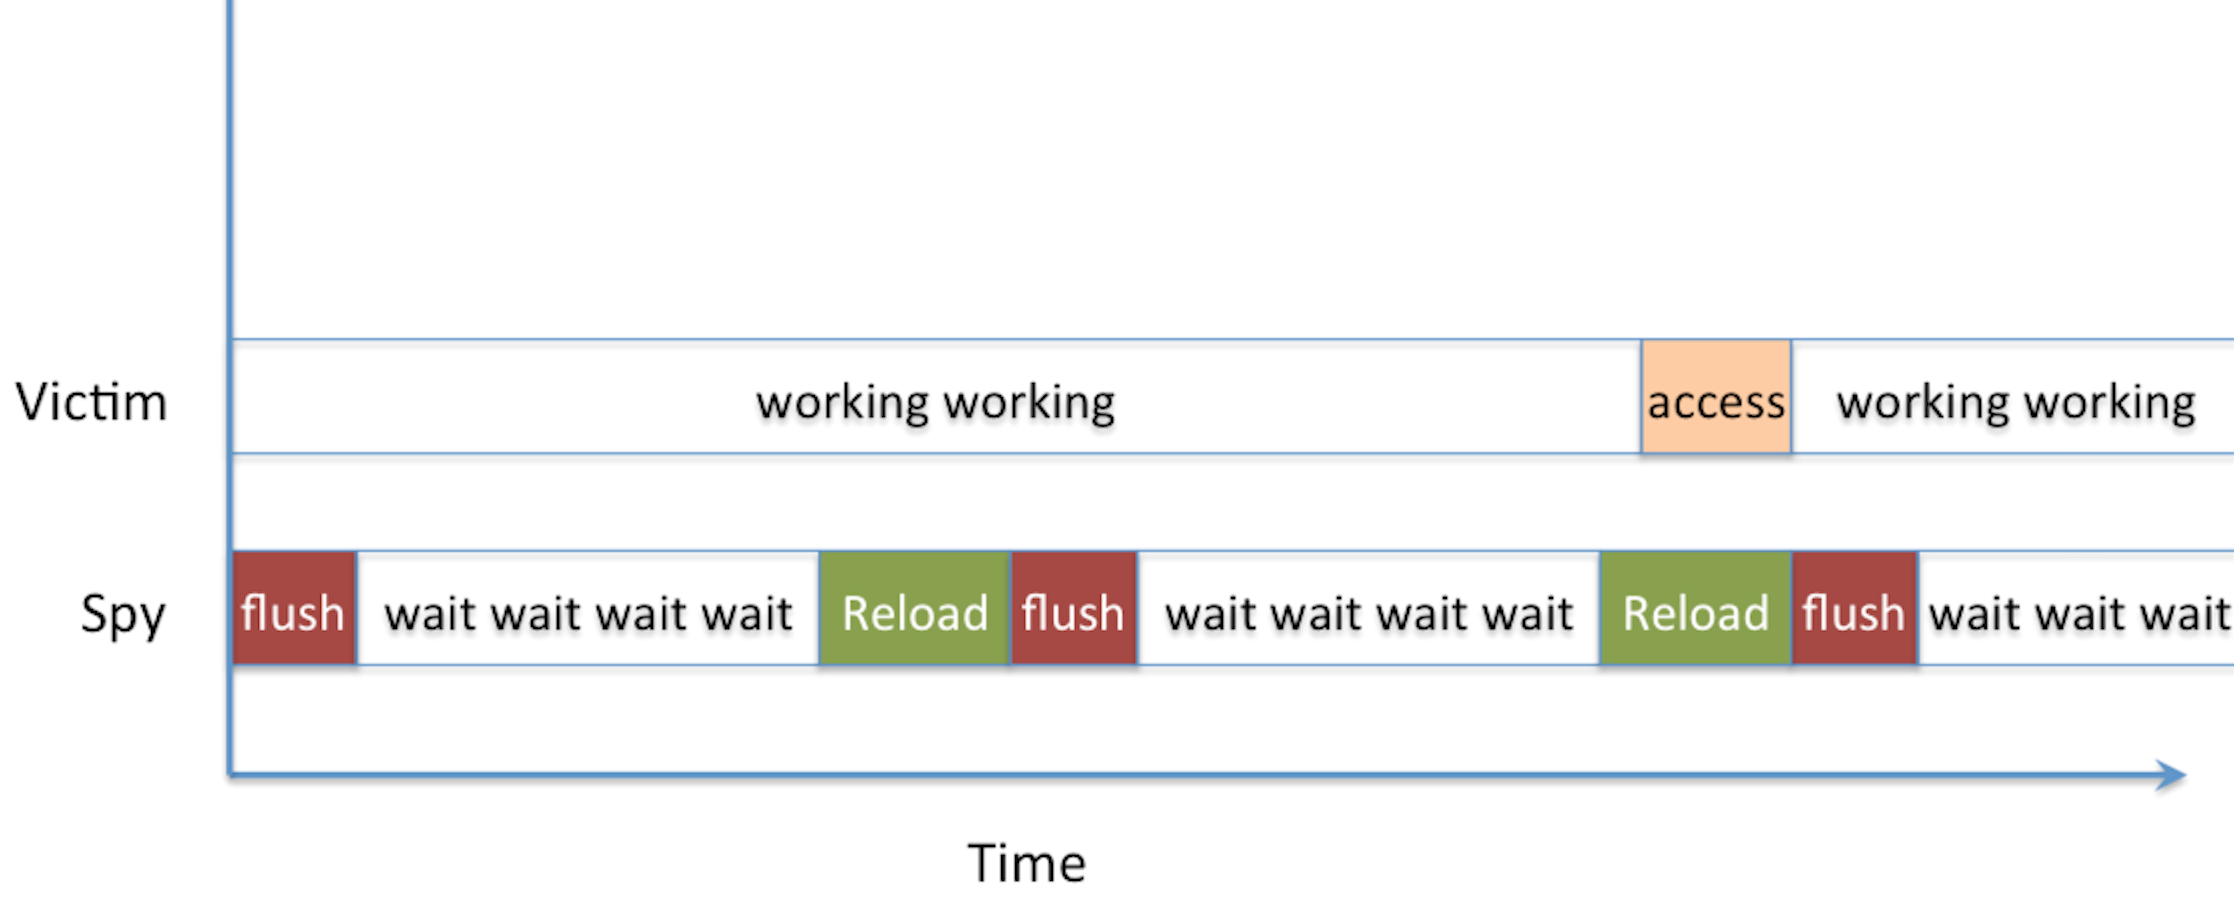
The Flush+Reload attack is straight-forward: you wait a bit, then you read from memory (it will cache it) and then you flush that cache position. Then you do that again and again and again. If a read takes a long time, it's normal. If it doesn't, it means someone else accessed it in memory and it was cached. The assembly of the attack looks like that:
mfence
rdtscp
mov %eax, %esi
mov (%ebx), %eax
rdtscp
sub %esi, %eax
clflush 0(%ebx)
clflush is the instruction to flush the cache, rdtscp takes the time (rather the number of cycles since boot). So you can compute the delta of the two rdtscp to get a runtime of the mov operation in between.
He demoed the thing via his tool FR-1-file-access.c. The program is pretty short and concise, it monitored a file continuously via reading and flushing, until it detected the use of the unix tool cat on the monitored file triggered by Yarom in another terminal. The code figures that a slow-read happened if it takes more than 100 cycles, it's not always a 100 so you have this FR-threshold.c program that you can use to see how long is the wait from a short-read to a long-read. If you want to play with the file, do a make in src/, then a make in demo.
After that he showed how to monitor calls to a function, in particular the standard C functionputs. He used nm /usr/lib64/libc-2.17.so | grep puts to get the offset of the function puts in memory, then FR-function-call let us monitor that position in memory.
One problem arrises if the victim access our monitored position right after we've reloaded the data from memory into the cache and right before we had time to flush it. The victim would then benefit from our load and get a short-read, and we will miss his access. That's a probe miss.
He then demoed an attack on GnuPG via the tool FR-gnupg-1.4.13.c, in particular the square and multiply algorithm inside GnuPG. The goal here is as usual to detect square-reduce from square-reduce-multiply-reduce operations, this would allow you to deduce the private exponent.
He looked at the code of GnuPG and noticed that they were using the lines 85, 281, etc... in the code. And then used gdb to see what were the addresses in memory for these lines (you can do the same using debuginfo.sh)
Yarom ran GnuPG to sign a file, while he ran FR-gnupg-1.4.13.c. He then gnuploted the results of his monitoring to look for patterns.
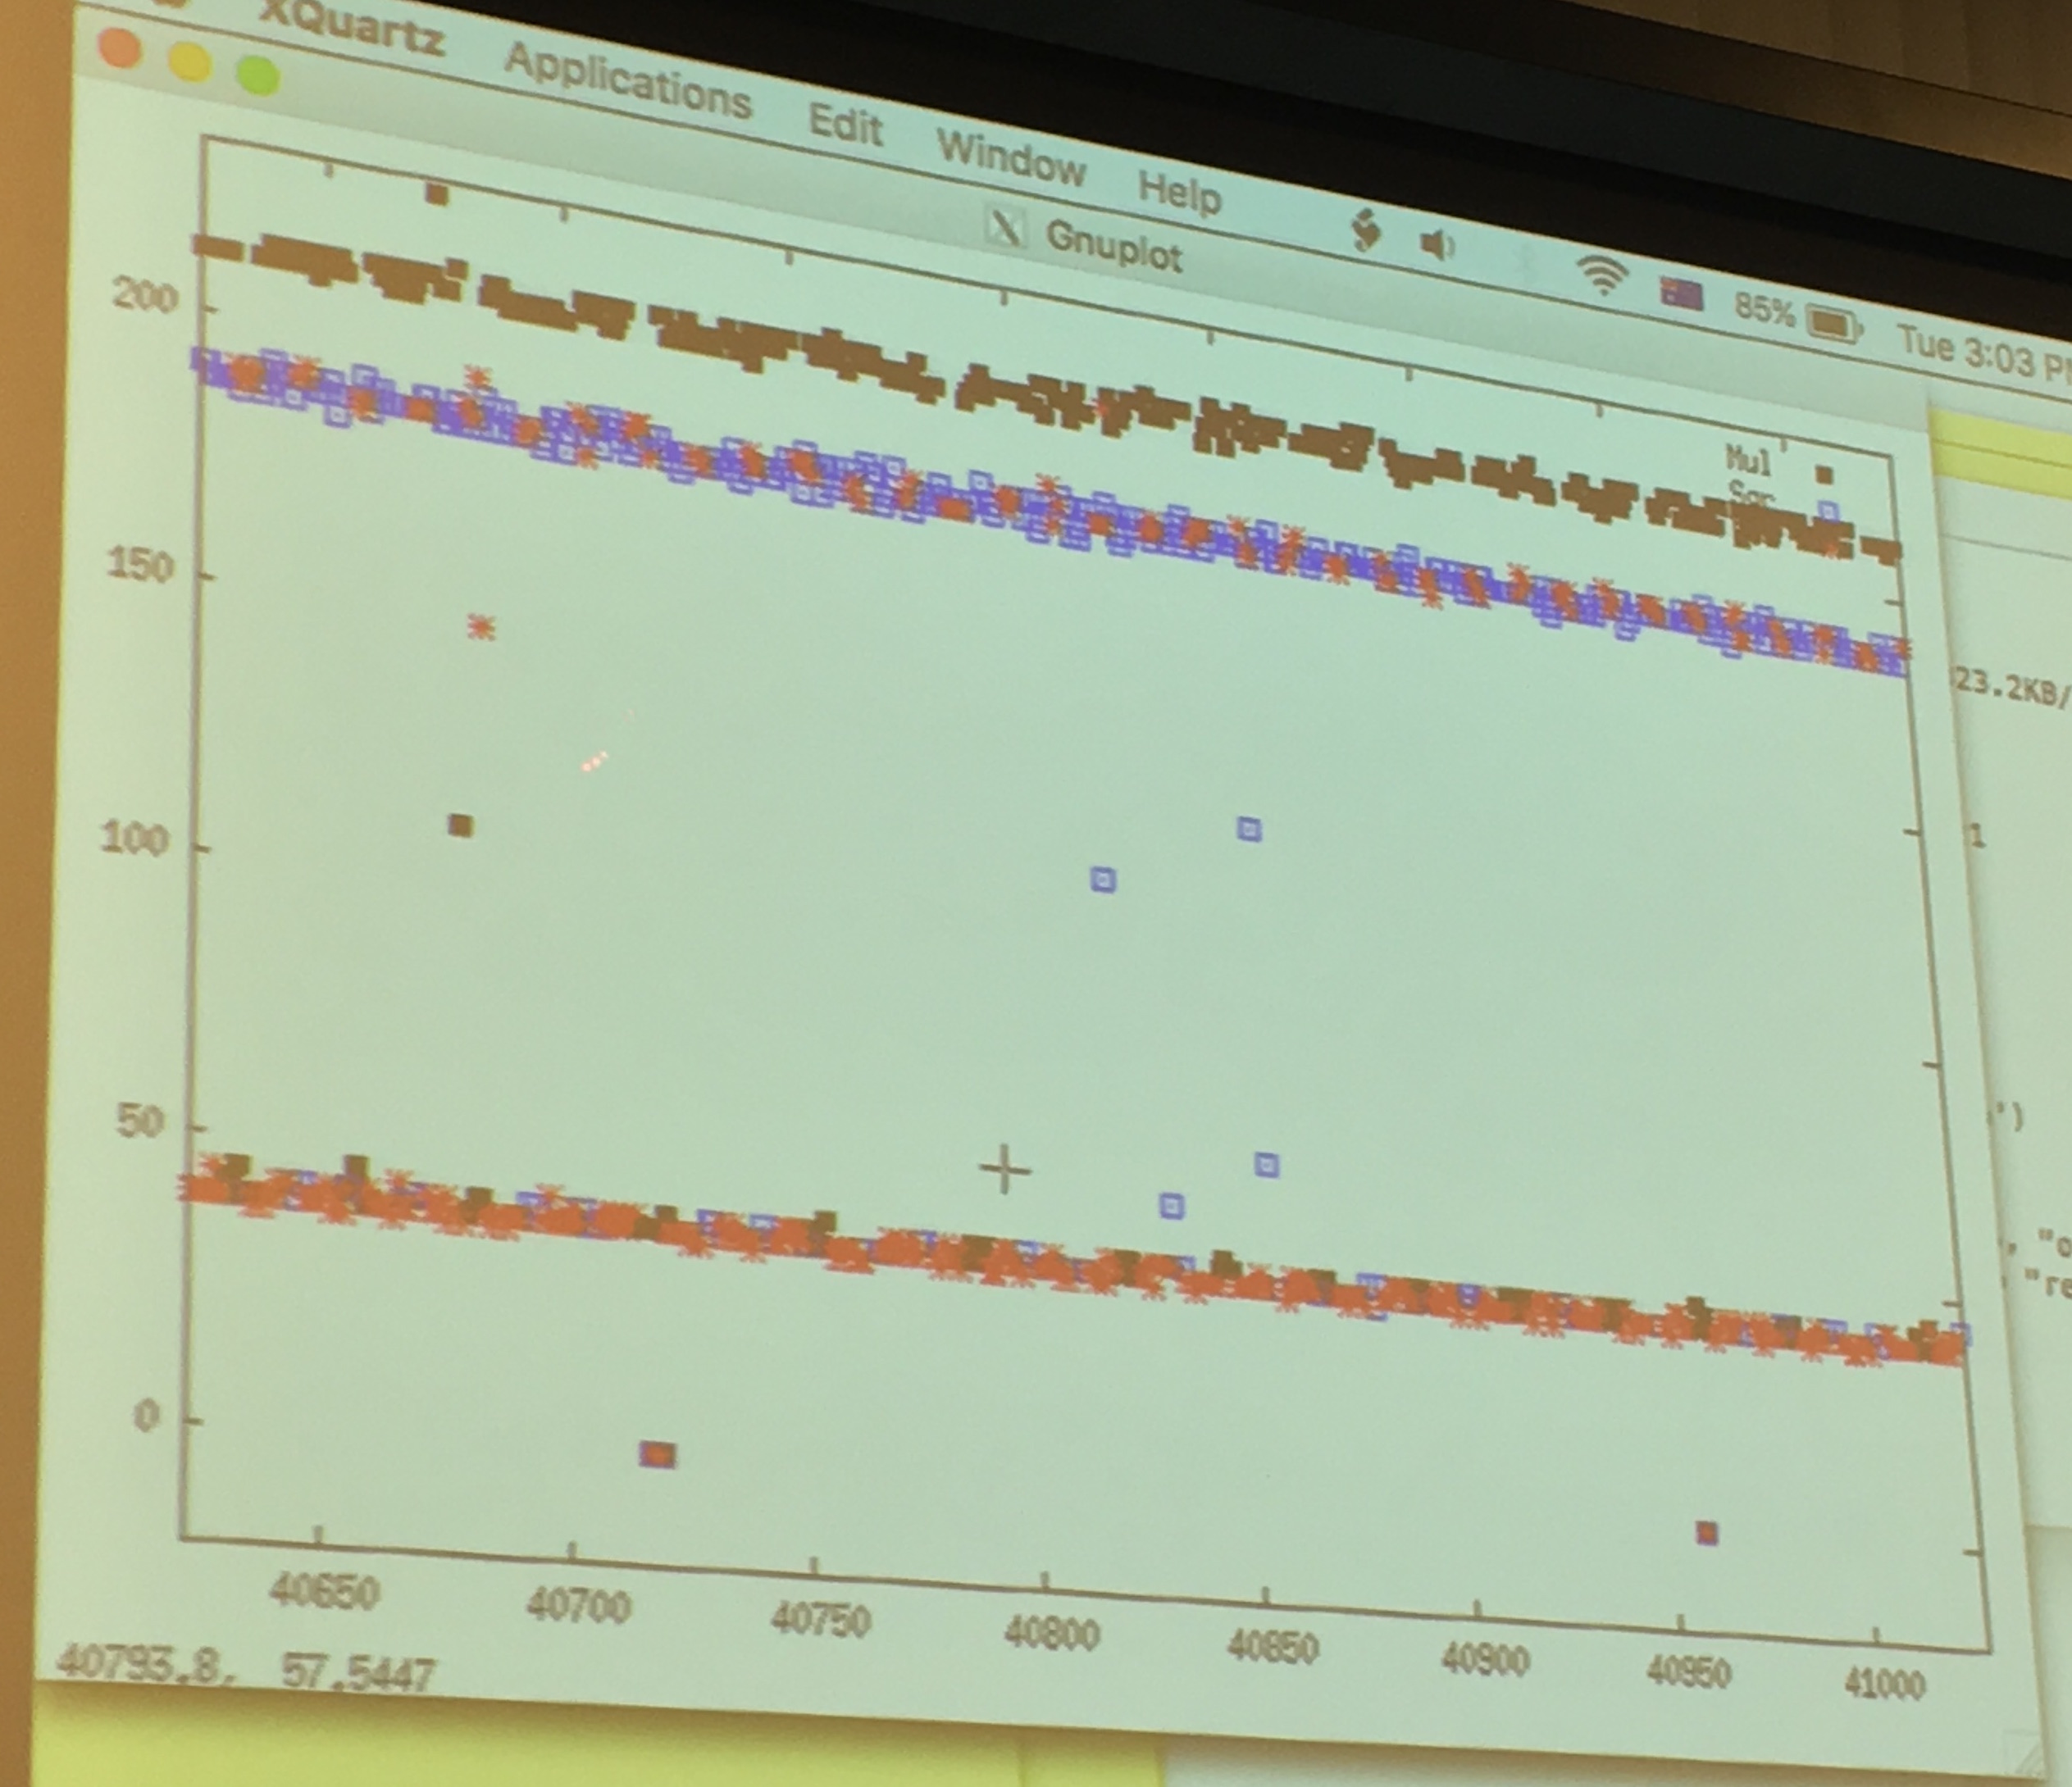
around the 50 line are the quick cache access, around the 200 line are the slow read from memory.
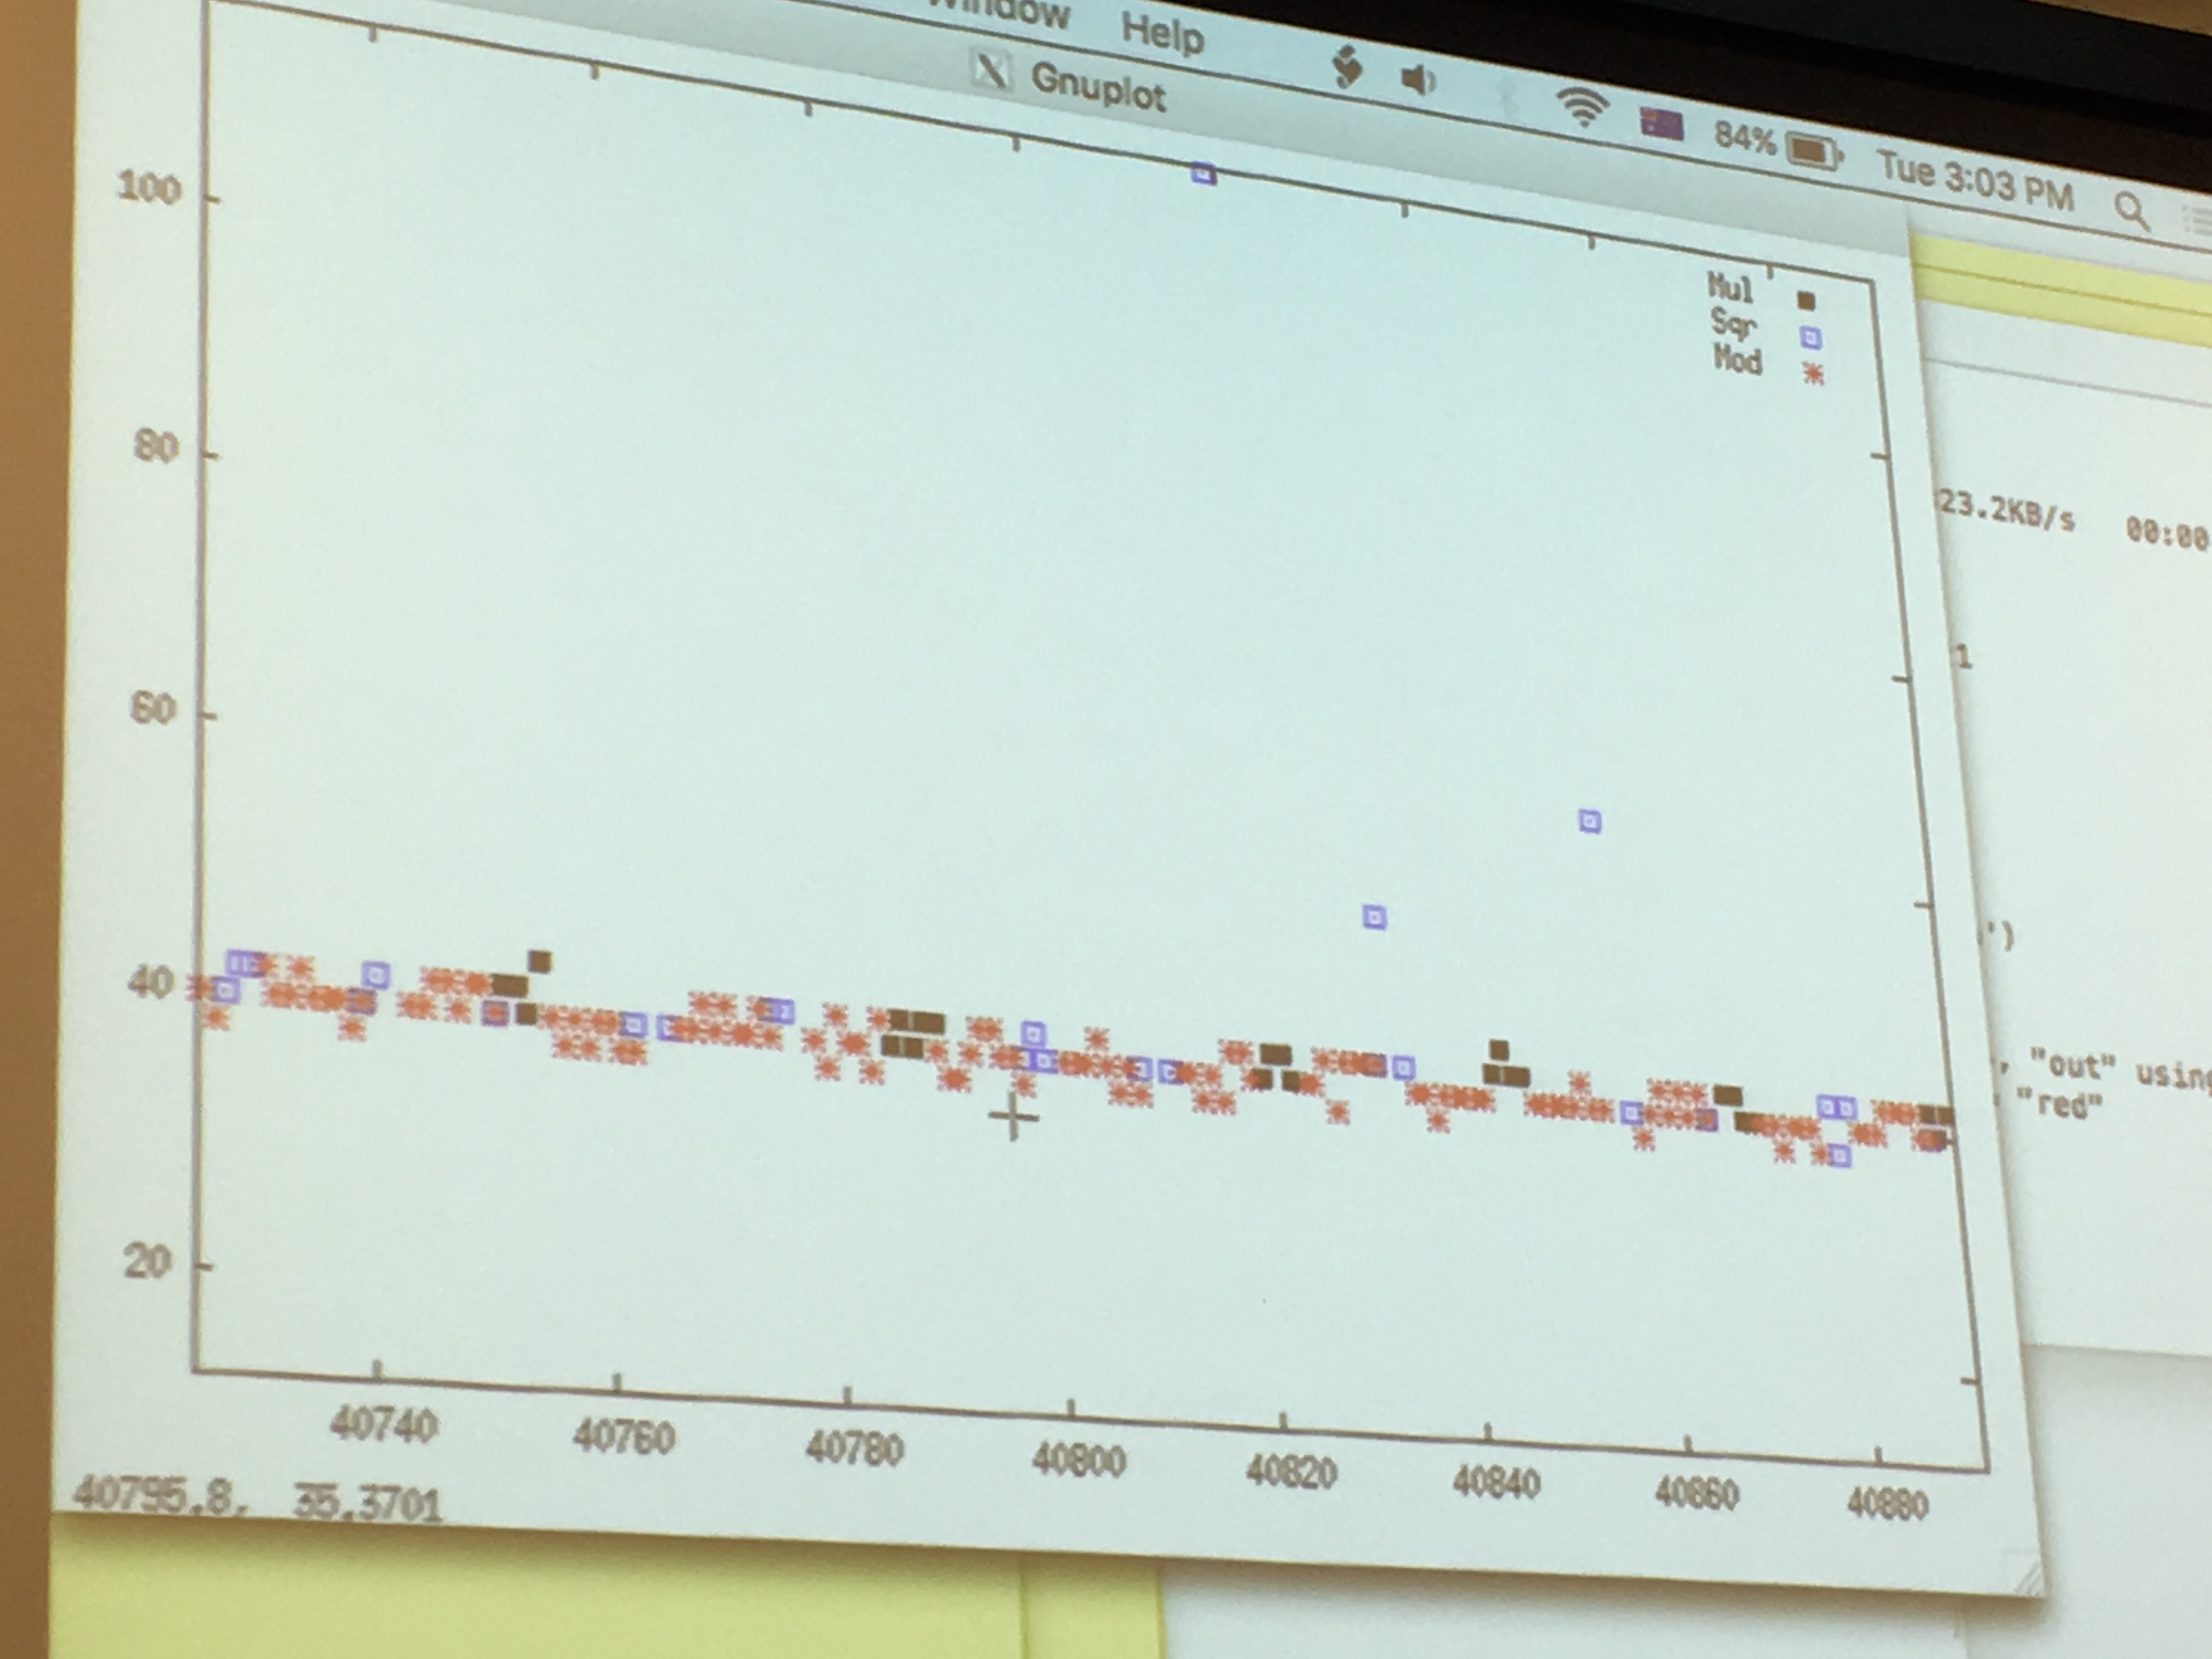
If we look only at the quick cache access, that are quick probably because the victim just had accessed it and loaded it into the cache before us, we can see that: red is the square operation, blue is the multiply operation and we can read out the key directly like a good ol' Simple Power Analyzis. There will be errors/noise of course, so run it several time! But even if you don't know all thebits, you can probably already break RSA.
There are some problems though:
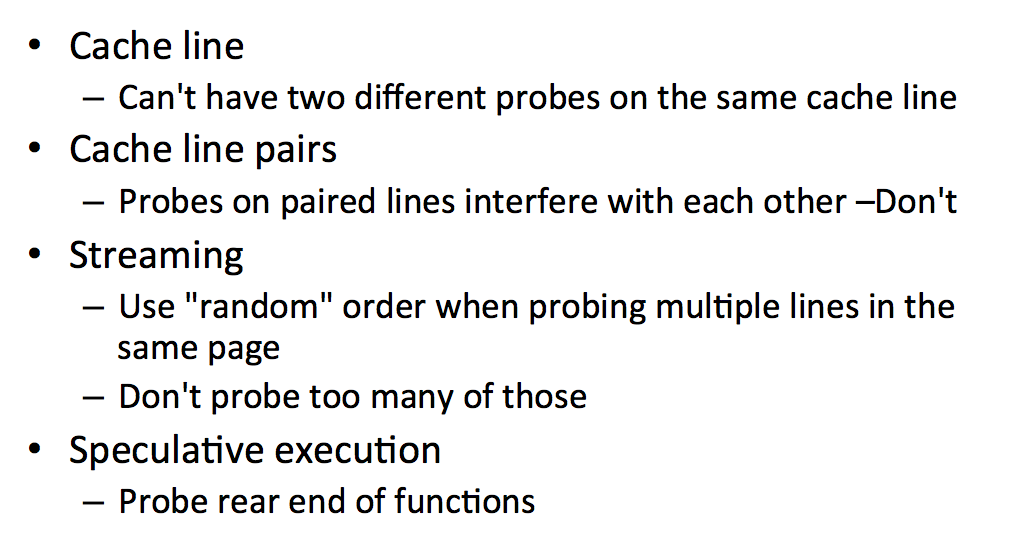
There are also ways to improve the flush+reload attack:

It seems like the first trick slows down the victim by running a lot of processes in parallel. The second improvement flushes commonly used cache lines to slow down the victim as well.
Variants of this flush+reload attack exist:
- Evict+Reload uses cache contention instead of
clflush, you replace the memory by loading something else instead of flushing it (naturally, flush happens rarely, eviction is what is really happening). - Flush+Flush (same people as Flush+Reload). They realized that if we used flush on some data that was already in the cache it's slower, if we do the flush and the data is not cached it will be faster. But the error rate is increased so...
- Invalidate+Transfer, don't ask me about this one.
Now a new attack, Prime+Probe!
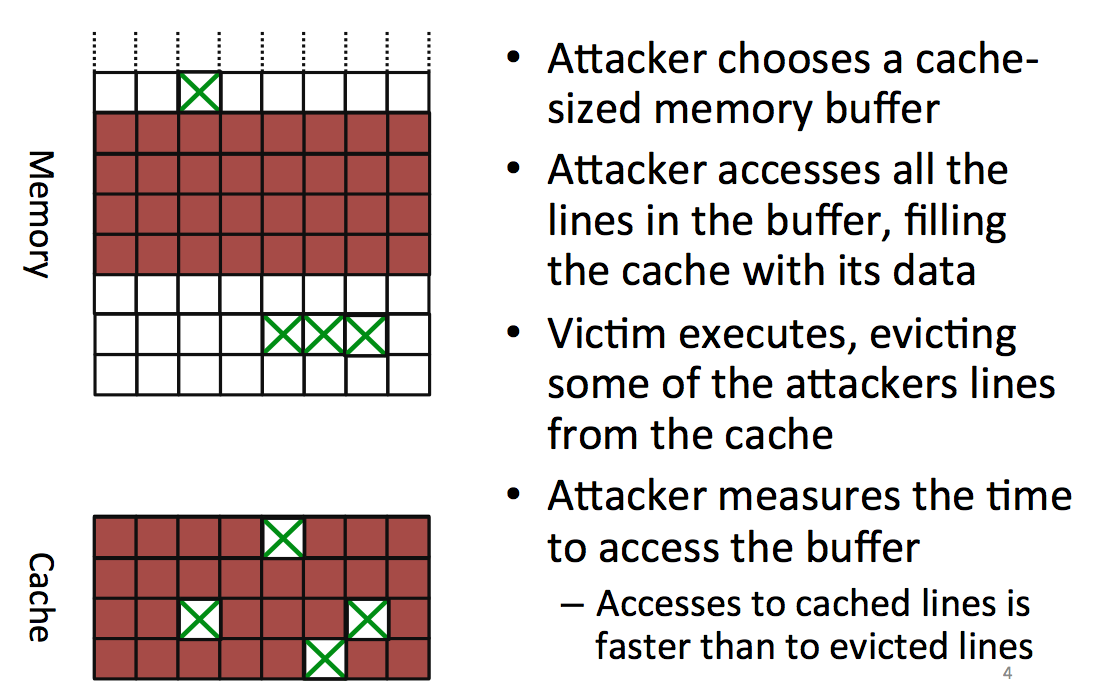
The attacker starts by choosing a block in memory, big enough so that it will cover all the cache, he then accesses that part of the memory to fill the entire cache with the attacker's data. You might want to fill parts of the cache that will be used by the victim's process as well. To do that you can trivially compute what will be the physical adresses mapped to your virtual cache.
After you filled the memory, you let the victim execute his process and access some places in memory to load it into the cache. This is evicting/removing some of the data that the attacker already loaded in the cache.
Now the attacker reads again the same block from memory and can see which parts have been removed because they take longer to load. By looking for patterns in there he can do another attack.
One problem: our code uses the cache as well! (here's the observer effect for you). Another problem: you can't write something useless to fill the cache, the compiler removes what he thinks is dead code/useless code (optimization). Here you need to know your compiler or... use assembly.
Thrashing is another problem that makes us miss victim's access.
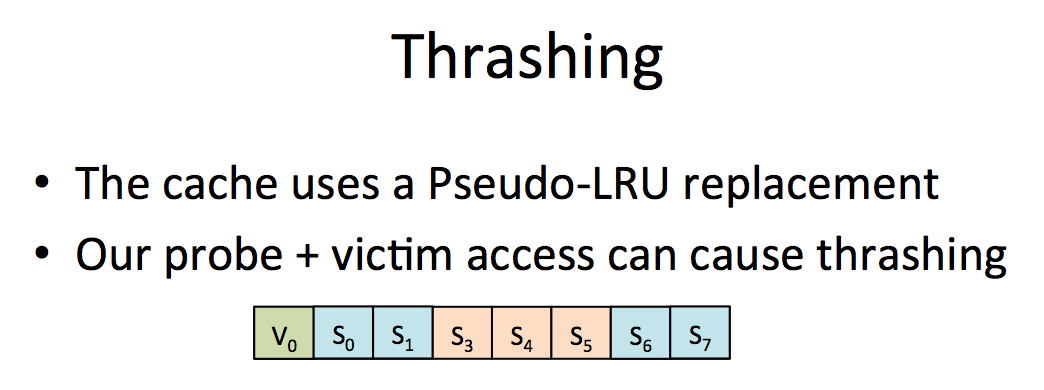
solution: zig zag on data. If someone knows what that means...
Another problem is Hardware prefetcher. The CPU brings data to the cache before it is being accessed (to optimize). The solution to that is to use pointer chasing: each future access depends on the previous one, so it kills any optimization of that sort.
Yarom demoed this. This time the tool was bigger. It's a L1 cache attack with L1-capture.c and L1-rattle.c. In L1, contrarily to flush+reload, we can monitor everything. So the default is to monitor everything. To do this attack you need to share a core with the process, which doesn't happen a lot, I'm not sure if you can do this attack on a shared cache. I don't see why not though, if someone can clarify...
Finally, Yarom presented some countermeasures to these kind of cache-timing attacks:
- don't share your hardware
- use hardware cache partitioning (intel cache allocation technology), this way you can decide in which way processes should have separated access in the cache.
- use cache randomisation instead of mirroring the memory.
At the system level, we can reduce the way we share memory. Of course if you don't share cores you avoid a lot of attacks, but you will need a lot of cores... Cache coloring is the idea of protecting certain places of the cache. There is also CATalayst and CacheBar...
On the software side, the big countermeasure is constant-time programming. Some blinding helps as well.
Comments
Alex Pollack
Hi David,
My name is Alex Pollack and I'm a graduate student studying computer engineering at the University of Maryland. For a project in a computer security class, I'm looking into the effectiveness of prime and probe attacks as well as effective defenses today.
Could you help me out a bit with running Yarom's demo code? I've looked through the documentation he's provided and I'm a bit lost with some of the semantics. He refers to different methods such as XX_monitor() and XX_monitorall() using the term "points" in the description. What exactly do these points refer to? When I run L1-capture, what exactly is the output telling me?
Thank you.
Best,
Alex
leave a comment...